

- Which categories have the most unresolved conversations?
- Which teams or customer segments account for urgent work?
- How has category volume changed from week to week?
- Which conversations sit behind a particular status or tag count?
docs-handle-time tag: three Orders conversations and three Accounts
conversations. The library image separately illustrates saved report management.
Use your own tags and dates when following the examples in your organization.
Before you start
You need permission to read conversations to run and export reports. Owners, Administrators, Team Leads, and Users can create and change saved reports. Owner or Administrator access is required to configure Custom Dimensions. Reports use indexed production conversations managed by CXP; test conversations are excluded. Recent conversation updates can take time to appear in the index.Open the report library
Open Reporting → Drilldown Reports. The library shows each report’s name, description, grouping hierarchy, update time, and updater. Search by name or description, change the sort, or select a report to open it. Select New Report to create a report, or Import to start from an exported configuration. Row actions let authorized authors export or delete reports; select rows to delete several at once. Deletion removes the saved report configuration, not its conversations.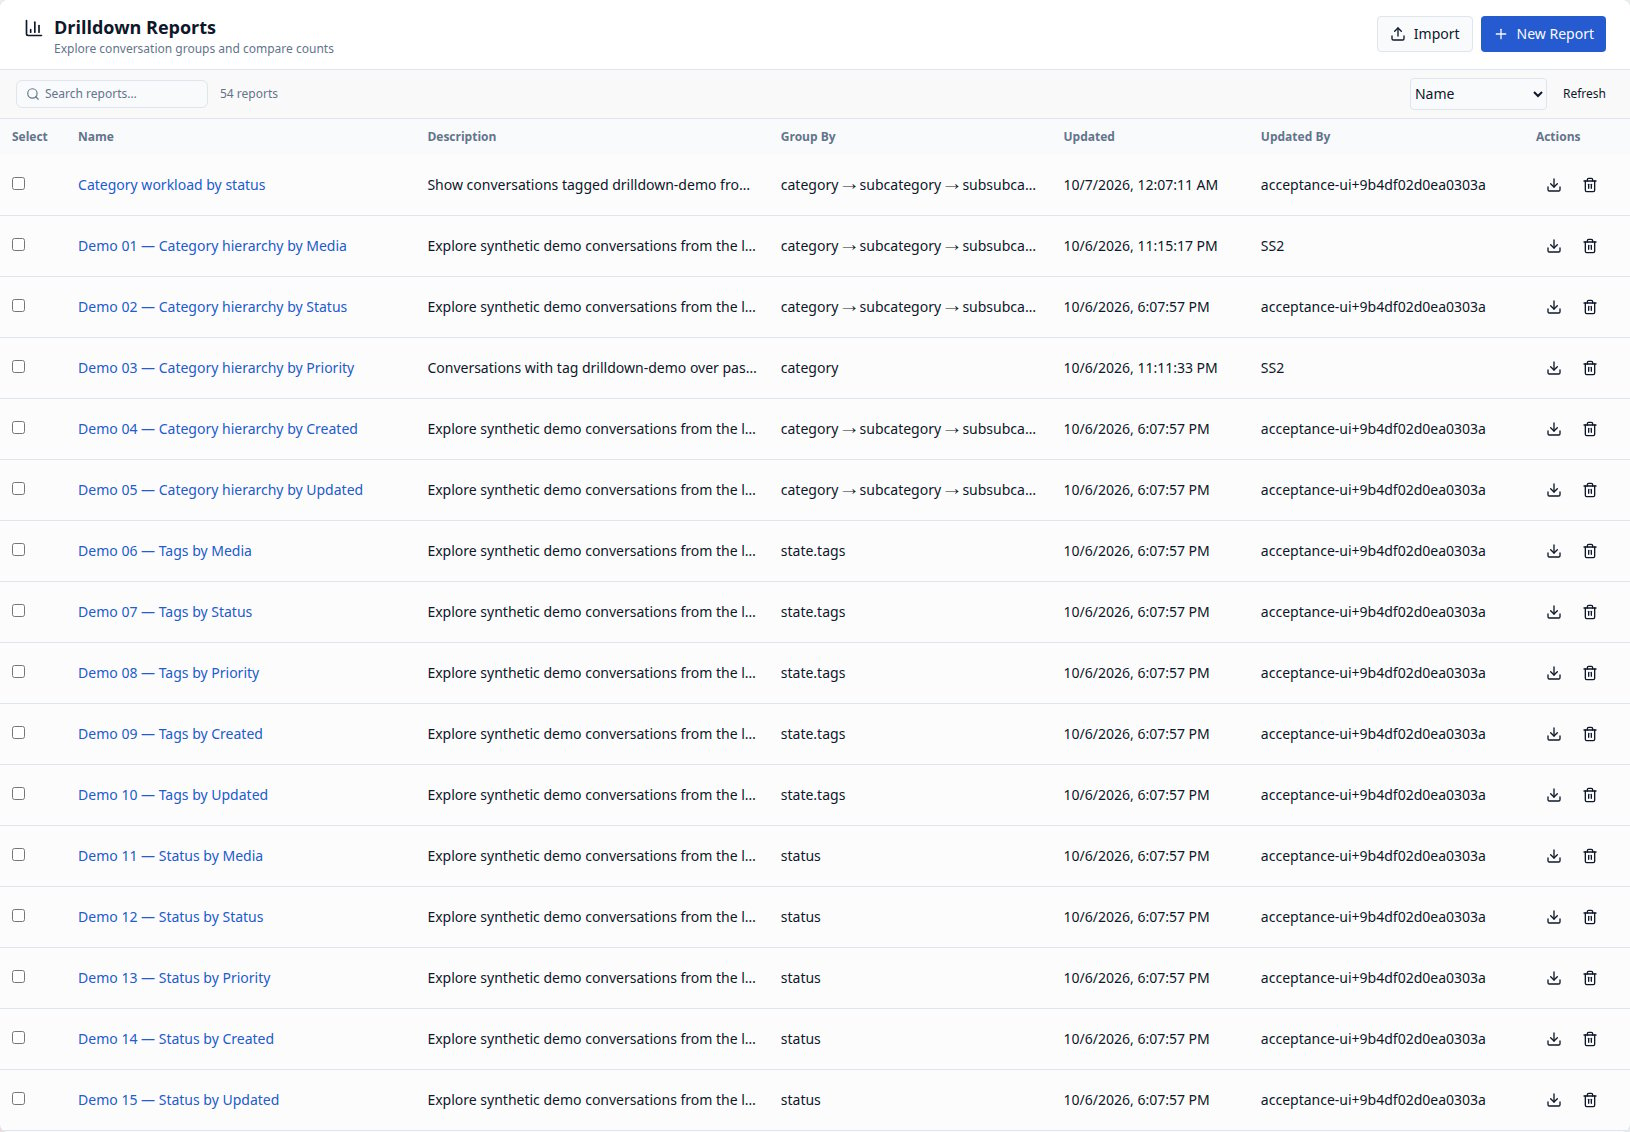
The report library, populated with synthetic examples of category, tag, status, priority, assignment, and team reports.
Create and configure a report
- Select New Report, enter a name and optional description, and select Create.
- Describe the population, grouping, and comparison you want in the Description area. Select Apply to generate a configuration.
- Review the generated filters, Group By, and Split By. Adjust them manually as needed.
- Inspect the results, then select Save to keep the configuration.
Describe what you want
Include the population, row hierarchy, and comparison in the request. For example:Choose the conversation population
The keyword and filter controls work like Search. Use Filter to add conditions such as Status, Priority, Assigned, Organization, Team, Pending On, Tags, Media, Category, Handle Time, Elapsed HT, or a configured custom dimension. You can include, exclude, disable, edit, or remove filter chips. Handle Time and Elapsed HT accept exact values or inclusive numeric bounds in seconds. Handle Time uses recorded completed-cycle totals; Elapsed HT also includes eligible agent work in progress at the run’s fixed cutoff. See handling-time filters for the controls and missing-data distinction. The Created filter selects the date range. Open it to choose a preset or custom bounds and review the timezone. Separate chips are combined with AND; multiple selected values within one chip are alternatives, combined with OR. For example, one Status chip containing Open and Pending includes either status. Adding a Priority chip containing Urgent narrows that population to urgent work.Choose rows and columns
Available properties include the category and handoff hierarchies, tags, media,
agent and assignment properties, status, priority, organization, team, pending
party, Elapsed HT, and configured custom dimensions. Grouping by a property does not filter
it out of the population.
Elapsed HT is a built-in numeric property: use it in Group By or Split By
without creating a Custom Dimension. It groups exact whole-second values,
rather than automatic duration bands. Conversations without usable progress
appear in the zero group, so that group can include fallback values as well as
recorded zeroes. Add numeric filters to focus on a particular duration range.
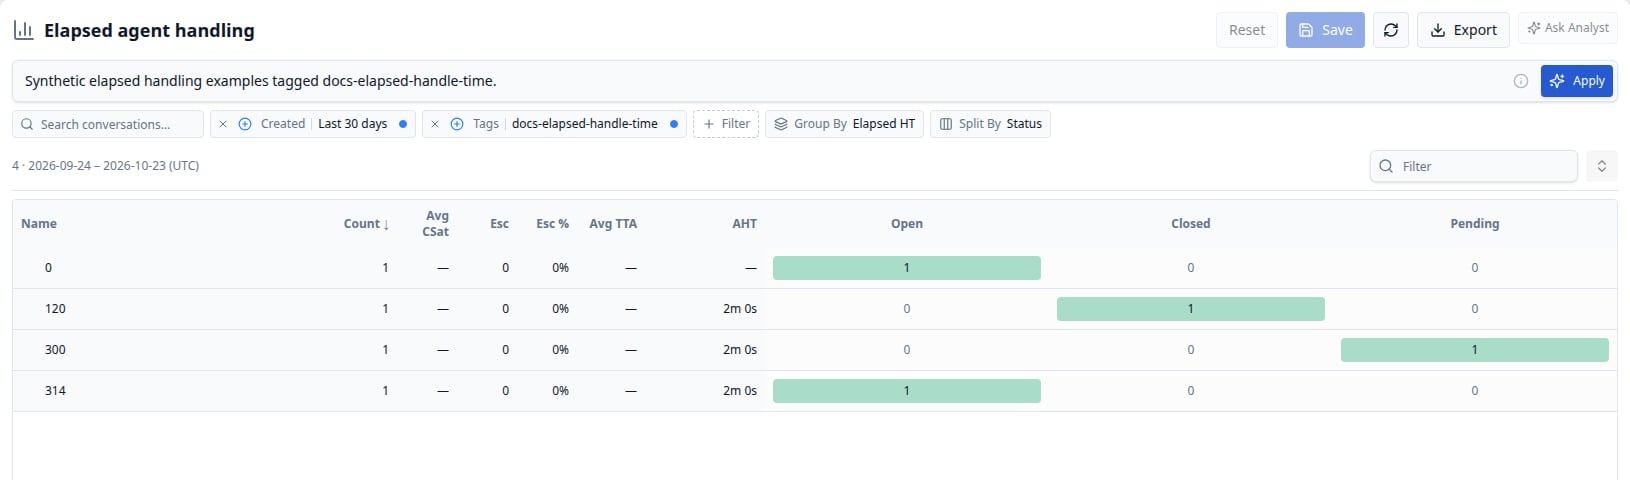
Group directly by Elapsed HT to count conversations at each whole-second value. Active work is evaluated at this report run's cutoff.
Example: inspect work inside a category
Configure the first example above. The six-conversation sample has three Orders conversations, all Resolved, and three Accounts conversations: two Resolved and one Open. Expand Orders → Delivery → General or Accounts → Access → General to inspect the complete category path.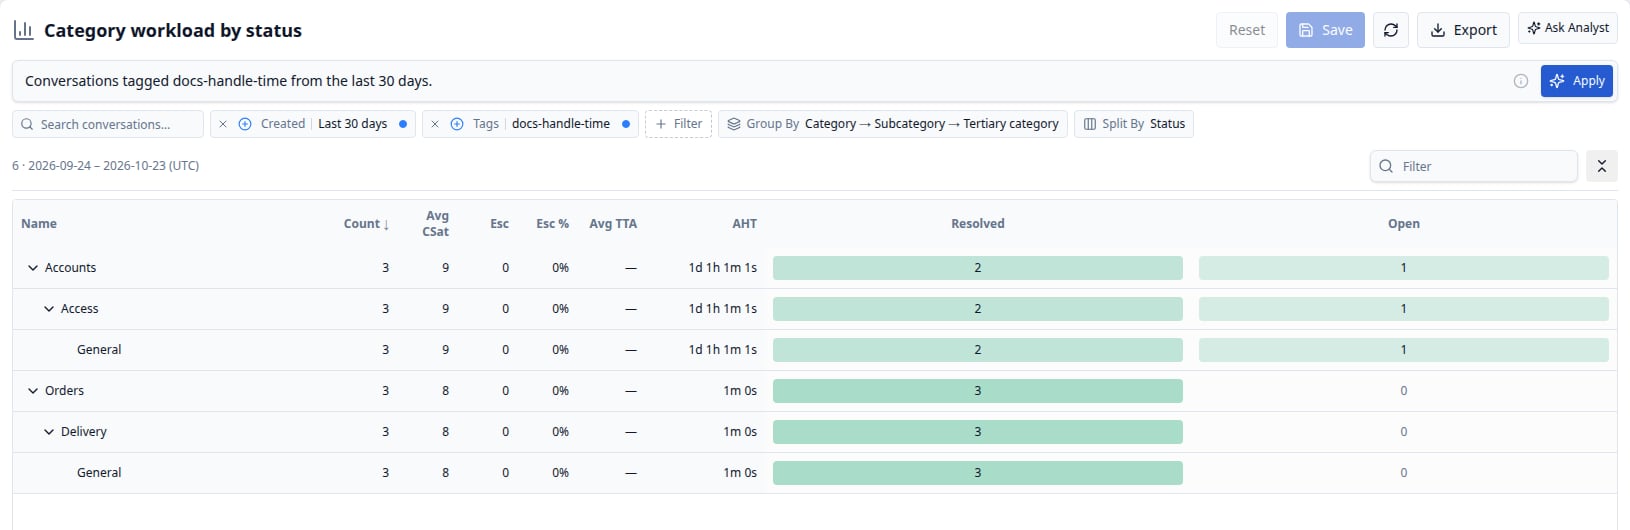
Six conversations grouped by category. Orders has three Resolved conversations; Accounts has two Resolved and one Open.
Open a main count or a split count
- Select Orders Count 3 to open all three Orders conversations matching the report’s filters.
- Select Orders Resolved 3 to add the Resolved status condition. All three Orders conversations match it in this example.
- Select a nested row’s count to include every category level in that row’s path.
docs-handle-time tag, Category Orders, and Status Resolved.
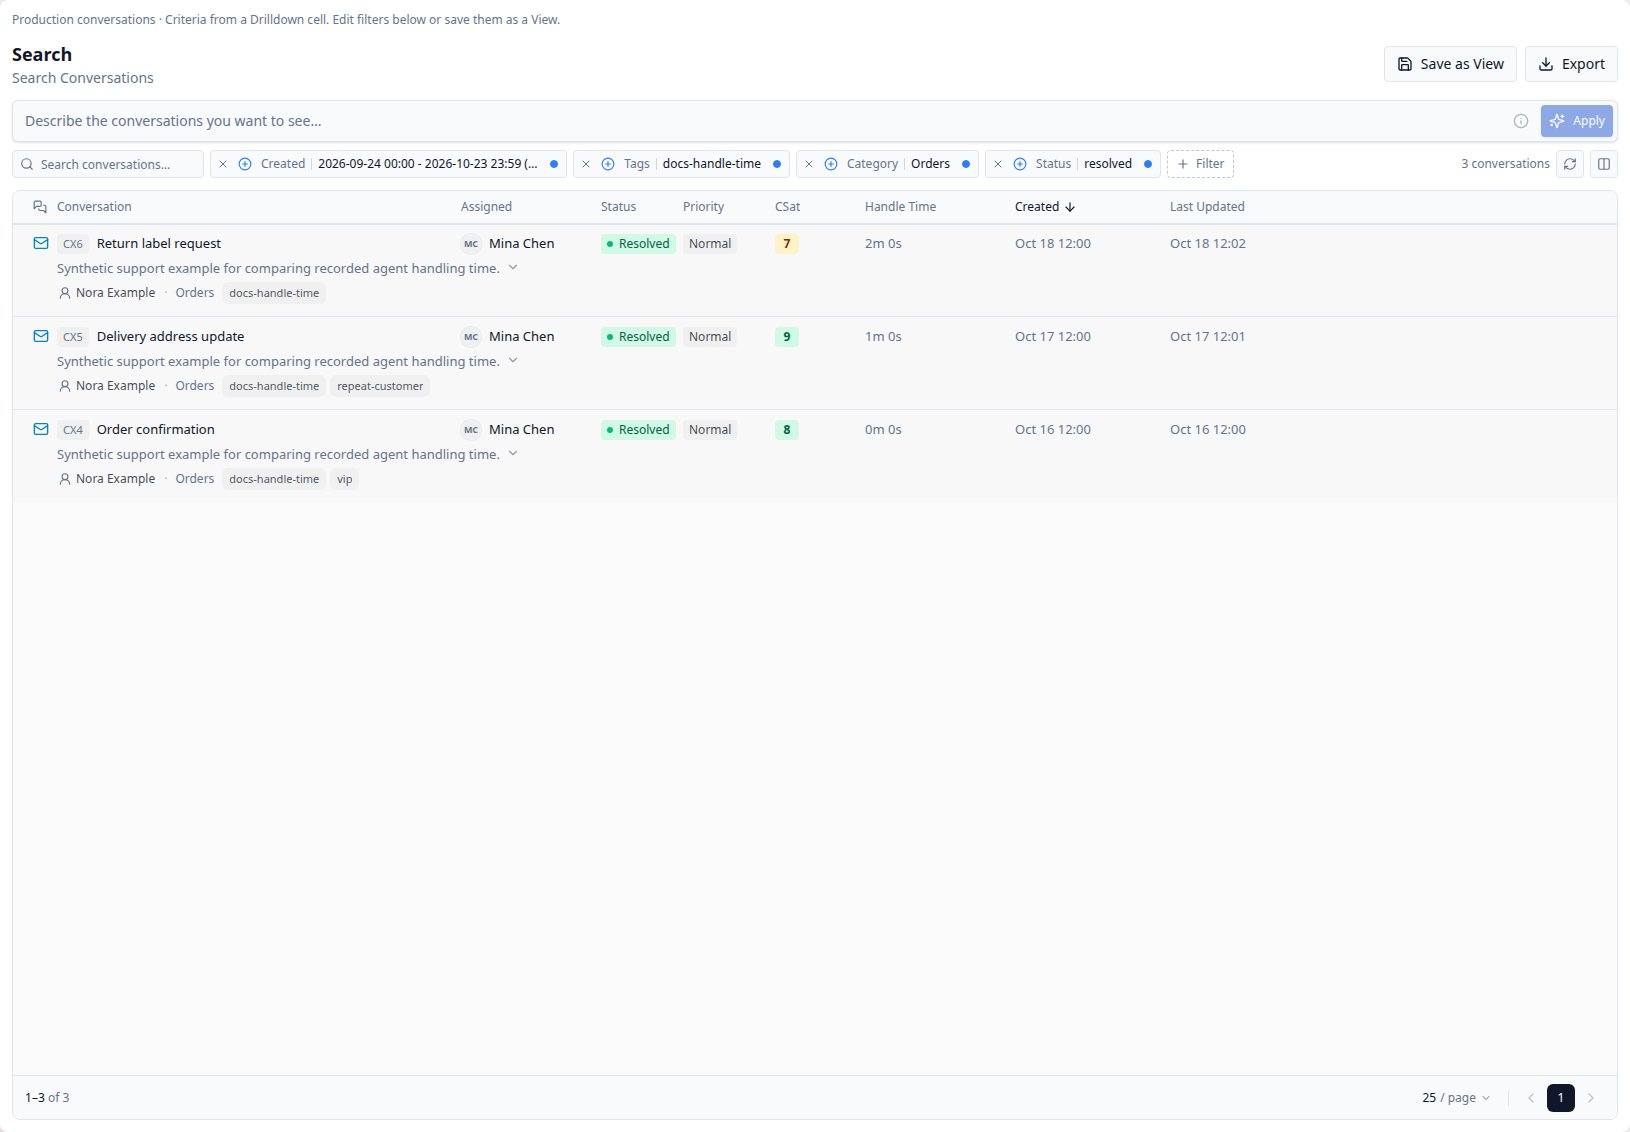
The Resolved cell opens three Orders conversations in Search. Every condition can be inspected or edited.
Separate conditions on the same property stay ANDed
Suppose a report is filtered to Tagstag-a and split by Tags. Opening the
tag-b cell adds another Tags condition:
tag-a and tag-b together inside one chip instead means
either tag. This distinction also applies to custom dimensions that emit several
values.
Example: compare weekly volume
Use this description, then select Apply: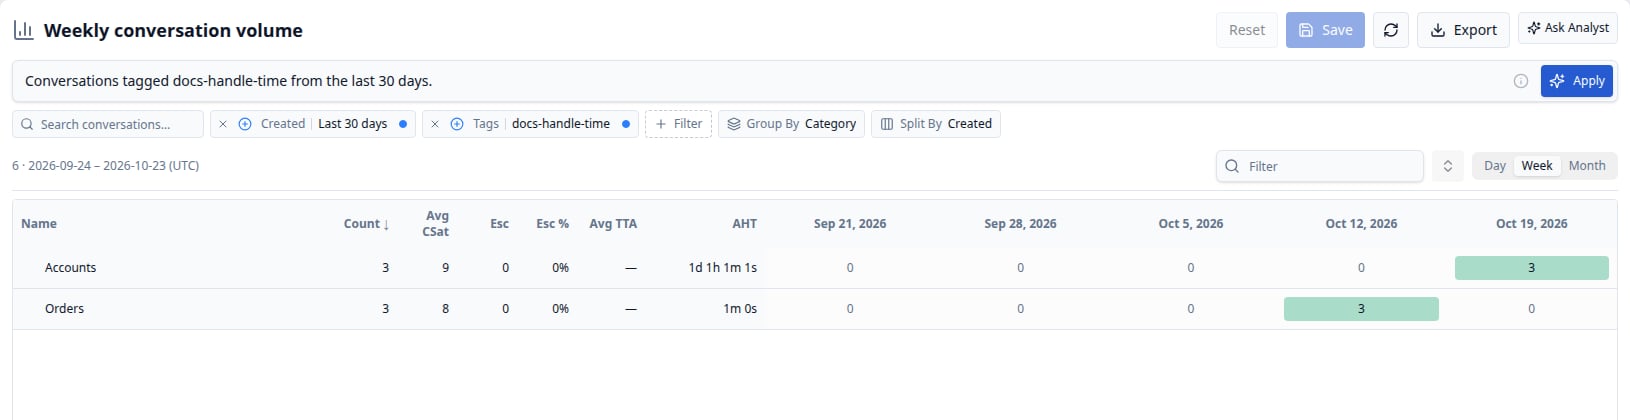
Compare category volumes across weeks while the row metrics stay fixed on the left.
Example: report on a business classification
Create the Support Segment dimension in the Custom Dimensions walkthrough, then choose it in Group By and choose Status in Split By. The six-conversation sample produces two VIP, two Returning, and two Standard conversations. VIP and Returning are all Resolved; Standard has one Resolved and one Open conversation. The dimension gives VIP precedence when both thevip
and repeat-customer tags are present.
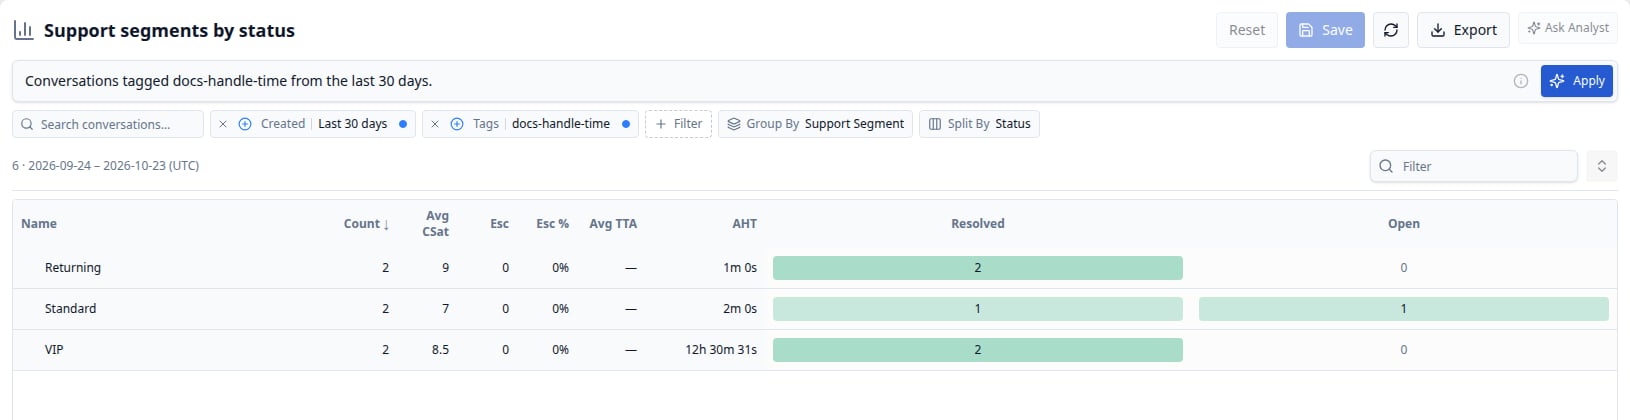
The six conversations divide evenly across VIP, Returning, and Standard.
Understand the metrics and table controls
A dash in a metric means there is no measurement; a recorded zero is a real
value. Elapsed HT grouping has a separate zero fallback described above. Parent metrics are
calculated from the parent’s own population. Tags and multi-valued dimensions
can put the same conversation into several groups, so child and split counts
need not add up to their parent.
AHT follows Avg TTA. Each conversation with a recorded Handle Time contributes
once to its row’s average; missing values are excluded and recorded zeroes are
included. Parent AHT is calculated from the parent’s conversations, not by
averaging child averages. Averages are rounded only for display; sorting and
Excel keep the numeric seconds.
In this sample, Orders has Handle Time values of 0, 60, and 120 seconds, giving
an AHT of 60 seconds. Accounts has one value of 90,061 seconds and two missing
values, so its AHT is 90,061 seconds. Across all six conversations, the four
recorded values average 22,560.25 seconds. Missing values do not enter the
denominator, and averaging the two category averages would give the wrong result.
Handle Time measures human-agent responsibility while a conversation is Open;
AI, team-assigned, and Pending time are excluded. Report filters select
conversations rather than limiting their recorded handling to the filter’s date
range. See Conversation Handle Time Reporting
for the calculation rules, reopening behavior, and practical report examples.
Above the table, the left side shows the total and Created range used by the
result. Filter on the right searches row labels; it does not change the
conversation population. Select a column heading to sort within each group, or
use the Expand all / Collapse all icon. Scroll horizontally for more split
columns: Name through AHT stay fixed, with a shadow at the edge.
Save, export, and maintain reports
Click the title to rename a report. Enter or clicking outside accepts the title edit; Escape cancels it. Select Save to persist configuration changes, or Reset to restore the last saved configuration. Leaving with unsaved changes opens Keep editing / Discard changes. The Export menu provides two different outputs:
Custom dimensions referenced by an imported report must already exist in the
destination organization. Compatible legacy report configurations can also be
imported; unsupported filters are rejected visibly.
When available, Ask Analyst starts a private analysis session from the report.
It is disabled for reports using custom dimensions, or Elapsed HT as an
enabled filter, grouping, or split, because Analyst cannot execute those calculated
values. Numeric keywords can also disable the action because those searches
can depend on the calculated value.
Ordinary word keywords and a report’s recorded AHT metric alone do not disable
Ask Analyst. Report exports remain available.
Troubleshooting and limits
Reports discover up to 100 values per branch or property split, plus missing
values, and show a warning when values are omitted. Returned cells are counted
using their complete conditions. Export contains the returned tree, not any
omitted groups. Very large cell-filter URLs may require simpler criteria.